Sigma
|
SIGMA and ERRORSBack to VTube-LASER |
|

Contents |
|
Most have heard of the "bell curve" in mathematics. This is the shape that describes the probability that a given percentage of measurements will fall within a certain region under a standard bell curve. This shape is found in nature - so its one that mathematicians use often to predict the chance that something will occur by natural forces. (This shape of the standard bell curve is formed by what is called "Normal Distribution" or "Gausian Distribution" of the data.) |
|

How does SIGMA Apply to a Standard Bell Curve?
|
A statistical measurement called "standard deviation" is also referred to as the region between the two sigma lines on the horizontal axis of a bell curve. The region between the two lines under the bell is the region called "1 sigma". The lower case Greek letter sigma is used like this: |
|
|
The sigma symbol is combined with numbers like this to help us know how many sigma regions we are referring to in the bell curve. |
|

"1 SIGMA" = 68% Chance (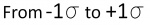 )
)
For predicting the greatest error in a measurement or calculation, if someone says that an an error value is repeatable within 1 sigma, then that person is referring to the greatest possible error in between the lines marked with -1 sigma to +1 sigma in the bell curve. Add the percentages of the two regions under the bell to get about 68%. There is a 68% chance that the error will not exceed the value stated.
"2 SIGMA" = 95% Chance (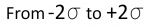 )
)
For predicting the greatest error in a measurement or calculation, if someone says that an an error value is repeatable within 2 sigma, then that person is referring to the greatest possible error in between the lines marked with -2 sigma to +2 sigma in the bell curve. Add the percentages of the four regions under the bell between the - and + sigma lines to get about 95%. There is a 95% chance that the error will not exceed the value stated.
"3 SIGMA" = 99.6% Chance (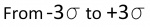 )
)
For predicting the greatest error in a measurement or calculation, if someone says that an an error value is repeatable within 3 sigma, then that person is referring to the greatest possible error in between the lines marked with -3 sigma to +3 sigma in the bell curve. Add the percentages of the six regions under the bell to get over 99%. There is a 99.6% chance that the error will not exceed the value stated.
How "2 SIGMA" applies to VTube-LASER SEF2 Values
The 2 Sigma value is used quite a bit for measuring. For example, when VTube-LASER reports Cylinder Fit errors, it always shows the values as "SEF2" or "standard error fit X 2" - which is the same as 2 sigma or (2 times the sigma) value calculated. This lets you know there is a 95% chance that the error or deviation reported in the Cylinder Fit window will not exceed that value.

Other Pages
Back to VTube-LASER
Back to VTube-STEP