Difference between revisions of "Sigma"
(→2 SIGMA and VTube-LASER SEF2 Values) |
|||
| Line 64: | Line 64: | ||
If someone says that an error is 3 sigma, then that person is referring to the greatest possible error in between the lines marked with -3 sigma to +3 sigma in the bell curve (see the curve above). Add the percentages of the six regions under the bell to get over 99%. There is a 99.6% chance that the error will not exceed the value stated. | If someone says that an error is 3 sigma, then that person is referring to the greatest possible error in between the lines marked with -3 sigma to +3 sigma in the bell curve (see the curve above). Add the percentages of the six regions under the bell to get over 99%. There is a 99.6% chance that the error will not exceed the value stated. | ||
| − | === 2 SIGMA | + | === How "2 SIGMA" applies to VTube-LASER SEF2 Values === |
The 2 Sigma value is used quite a bit for measuring. For example, when VTube-LASER reports Cylinder Fit errors, it always shows the values as "''SEF2''" or "''standard error fit X 2''" - which is the same as 2 sigma or (2 times the sigma) value calculated. This lets you know there is a 95% chance that the error or deviation reported in the Cylinder Fit window will not exceed that value. | The 2 Sigma value is used quite a bit for measuring. For example, when VTube-LASER reports Cylinder Fit errors, it always shows the values as "''SEF2''" or "''standard error fit X 2''" - which is the same as 2 sigma or (2 times the sigma) value calculated. This lets you know there is a 95% chance that the error or deviation reported in the Cylinder Fit window will not exceed that value. | ||
[[image:vtube-laser_1_58_cylinderfit_highlight.jpg|500px]] | [[image:vtube-laser_1_58_cylinderfit_highlight.jpg|500px]] | ||
Revision as of 00:34, 4 October 2011
|
SIGMA and ERRORSBack to VTube-LASER |
|

Contents |
|
Most have heard of the "bell curve" in mathematics. This is the shape that describes the probability that a given percentage of measurements will fall within a certain region under a standard bell curve. This shape is found in nature - so its one that mathematicians use often. This shape of the standard bell curve is called "Normal Distribution" or "Gausian Distribution." |
|

HOW SIGMA PERTAINS to the BELL CURVE
|
A statistical measurement called "standard deviation" is also referred to as the region between the two sigma lines on the horizontal axis of a bell curve. The region between the two lines under the bell are is the region called "1 sigma". The lower case Greek letter sigma is used like this: |
|
|
The sigma symbol is combined with numbers like this to help us know how many sigma regions we are referring to: This is a probability of how much the measurements vary from the center value of the bell by a distance defined as sigma on either side of that center. (See + and - sigma in the graph above.) |
|


"1 SIGMA" = 68% Chance (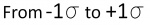 )
)
If someone says that an error is 1 sigma, then that person is referring to the greatest possible error in between the lines marked with - 1 sigma to + 1 sigma in the bell curve (see the curve above). Add the percentages of the two regions under the bell to get about 68%. There is a 68% chance that the error will not exceed the value stated.
"2 SIGMA" = 95% Chance (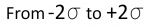 )
)
If someone says that an error is 2 sigma, then that person is referring to the greatest possible error in between the lines marked with -2 sigma to +2 sigma in the bell curve (see the curve above). Add the percentages of the four regions under the bell between the - and + sigma lines to get about 95%. There is a 95% chance that the error will not exceed the value stated.
"3 SIGMA" = 99.6% Chance (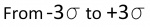 )
)
If someone says that an error is 3 sigma, then that person is referring to the greatest possible error in between the lines marked with -3 sigma to +3 sigma in the bell curve (see the curve above). Add the percentages of the six regions under the bell to get over 99%. There is a 99.6% chance that the error will not exceed the value stated.
How "2 SIGMA" applies to VTube-LASER SEF2 Values
The 2 Sigma value is used quite a bit for measuring. For example, when VTube-LASER reports Cylinder Fit errors, it always shows the values as "SEF2" or "standard error fit X 2" - which is the same as 2 sigma or (2 times the sigma) value calculated. This lets you know there is a 95% chance that the error or deviation reported in the Cylinder Fit window will not exceed that value.
